

Creative Planning · Oct 9, 2026 · 50m · 33m saved
With Charlie Bilello, Chief Market Strategist at Creative Planning
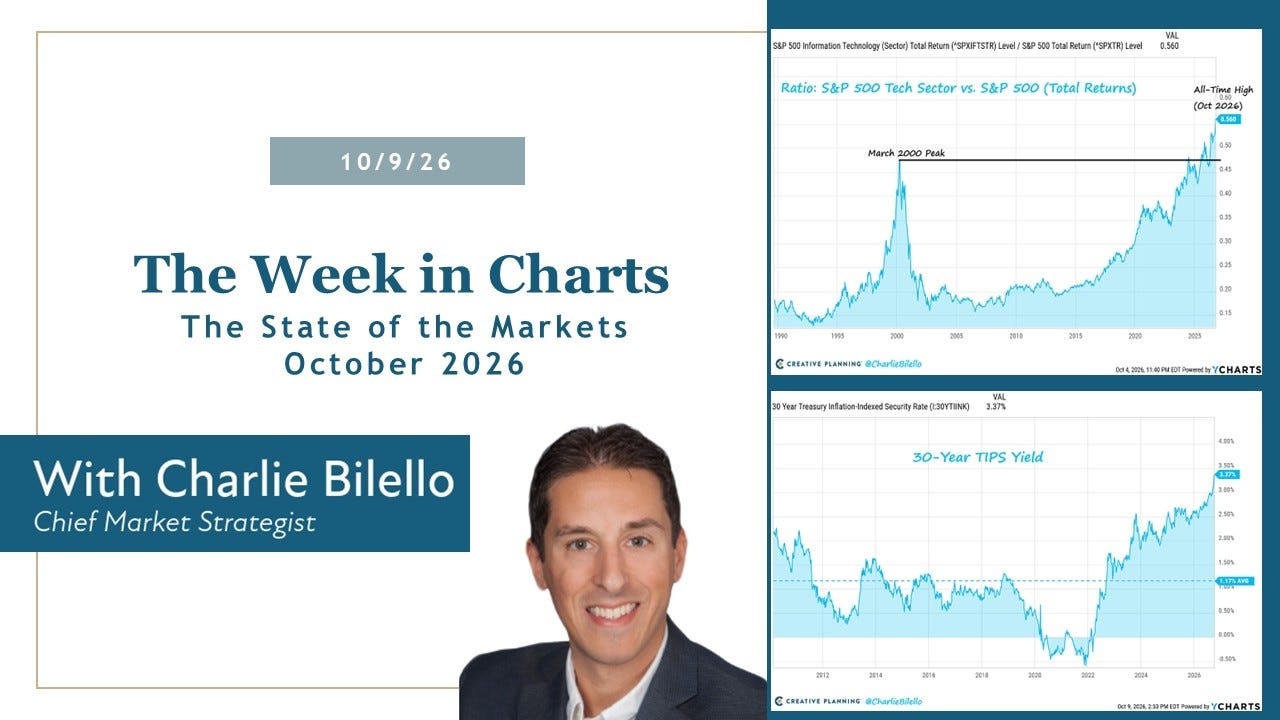
The 10-year Treasury yield reached 5.3% this week, its highest since 2002, while the S&P 500's dividend yield fell to 1.07%, the lowest on record.
For most of the last 15 years the case for owning stocks rested partly on bonds paying close to nothing. Charlie Bilello said that case has now reversed, even with the S&P 500 back at all-time highs.
"But I will say today, this is the best the bond market has looked relative to the stock market in over 20 years." — Charlie Bilello
Charlie Bilello, Chief Market Strategist at Creative Planning, on the firm's YouTube show, presents the charts behind that view each week on The Week in Charts and co-hosts the Signal or Noise? podcast with Creative Planning's Peter Mallouk. He is a Certified Public Accountant and a Chartered Market Technician, and his market charts are regularly cited by Barron's, Bloomberg and The Wall Street Journal, according to the firm.
The full episode is covered here so you can skip it. 50 minutes of audio, 17 minutes of reading.
Here are the 11 charts that matter.
Key Takeaways
The top 3 stocks now make up a record 21.7% of the S&P 500
Nvidia alone is worth more than the 2,000 companies in the Russell 2000 combined
Analysts expect 34% earnings growth for the S&P 500 this year, against about 15% in January
Higher yields have erased the small-cap lead this year
The Russell 2000 ETF was up more than 24% for the year and now sits 10% below that high
A 5.3% 10-year Treasury yield points to 5–6% annual bond returns over 7 years, so "there is no alternative" no longer holds
Stocks beat bonds by almost 17 points a year over 7 years, a record he expects to narrow
Fed hikes and cuts have not predicted stock returns
The S&P 500 has averaged a higher one-year return after hikes than after cuts
High-yield credit spreads, not Treasury yields, are his warning sign for when rates start to hurt stocks
Gold has fallen about 20% on a stronger dollar, higher real yields and a reversal after its record run
Jobless claims are at a 4-year low, and AI spending is creating jobs before it destroys them
1. Big Tech Back at Highs
Bilello opened with the S&P 500 back at an all-time high for the first time since August, up 15% for the year including dividends. At the end of March it was down 7%, one of the worst starts to a year on record. He compared the reversal with 2025, when tariffs caused the early losses. This year the cause was the war in Iran, which has not ended, and commodity prices remain high.
The S&P 500 has set 28 all-time highs this year, after 39 in 2025 and 57 in 2024
"So, we're running on now four straight pretty strong years for the market." — Charlie Bilello
"And the fourth quarter historically has been the best for the stock market." — Charlie Bilello
Every dip in tech's relative performance has reversed hard, and the sector is above its March 2000 peak against the S&P 500
Energy leads all sectors this year because of the rise in crude oil. Tech is second, up about 38%. Consumer discretionary stocks are last, down about 6%, which he tied to the same higher oil prices.
The equal-weight S&P 500 has hit its weakest level against the market-cap-weighted index since November 2002
The equal-weight index holds every S&P 500 company in the same amount. Its gains against the main index were wiped out in the past month as yields rose.
"So while the S&P 500 is hitting all-time highs this week, the same is not true for the average stock in the S&P 500 and definitely not true for the small cap indices like the Russell 2000." — Charlie Bilello
Small caps led large caps by about 10 points six weeks ago. Large caps are now slightly ahead
The iShares Russell 2000 ETF (IWM) was up more than 24% for the year at its high. It is now up a little over 13%, but sits 10% below that high.
"So what the market is saying is higher interest rates are going to cause more problems for small cap stocks than large cap stocks." — Charlie Bilello
